|
Logarithmic
scaling in an African Windscreen |
|
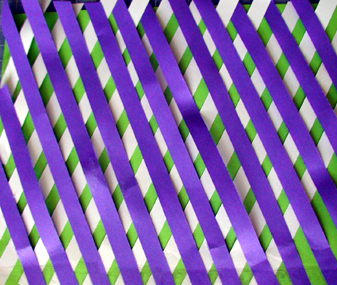
Cut paper strips and tape bottoms as shown (this is a 65 degree angle but you can experiment) |
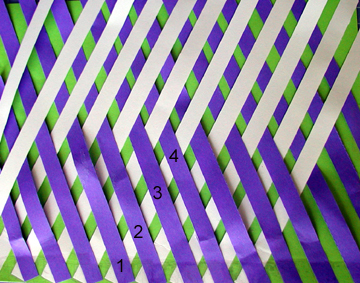
Now bring the white strips to the top after they have been under 4 blue strips |
Now bring the blue strips to the top after they have been under 2 white strips |
|
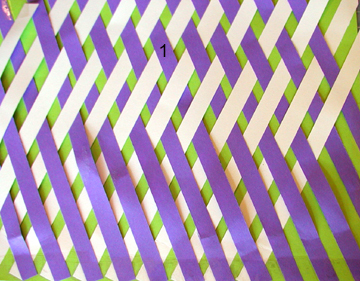
Now bring the white strips to the top after they have been under 1 blue strip. |
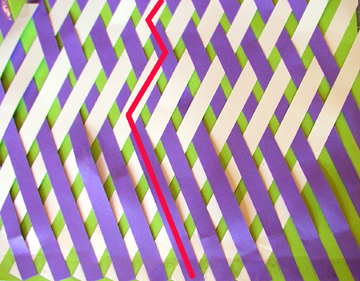
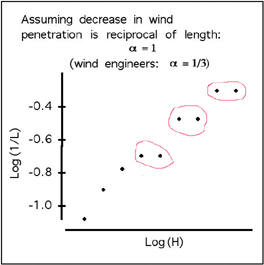
The scaling zig-zag we saw now makes sense: a pattern like "under 4, under 2, under 1" produces the quantitative scaling we saw. This also explains why we see "staircasing" on the graph: you have to repeat the values to maintain that slope because you can't go "under 0.5"-- its a discrete approximation.
|
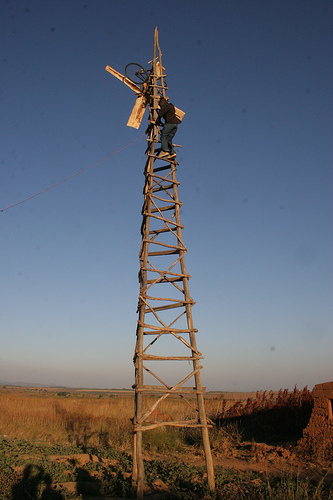
You can experiment with various patterns and angles to see what effect they have on the scaling of the windscreen. What other scaling exponents can you create? Is the African version the closest you can get to the exponent in the wind engineering handbook? If so, how did they end up with the optimal scaling without using calculus or some algebraic calculation? We often see scaling in windmill support towers all over the world: why? This windmill was built by a teenager in Africa. It provides electical power for his family and neighbors. Learn more in the TED video .
|
